
- trading strategies framework used by institutions
ASVP PRICE ACTION TRADING, TRAINING & RESEARCH
PROFESSIONAL PRICE ACTION MENTORSHIP PROGRAM
At ASVP, You learn how an Big Players/Fund house analyze market through proprietary techniques through a Mentorship Program. It breaks pattern mindset trading style & develop an interpretations based skill.

What is Price Action Trading?
- Meaning of Price Action Trading
- Trading with “Jumbled” Vs “Clean Chart”
- How to differentiate between Trending Market & Range Bound Market.
- How to trade with price action trading techniques.
- How to trade confluent zone using price action trading.
Definition of Price Action Trading
Price Action Trading (P.A.T.) involves making all trading decisions based on a simplified or “naked” price chart, devoid of lagging indicators except for a few moving averages to identify dynamic support, resistance areas, and trends. All financial markets produce data regarding price movements over different time frames, and this data is presented on price charts. These charts reflect the beliefs and actions of all participants (human or computer) trading within a certain period, represented as “price action” (P.A.).
Although economic data and global news events trigger price movements in a market, analyzing them is unnecessary for successful trading. This is because all economic data and news that influence market prices are ultimately reflected in the P.A. on a price chart.
Since a market’s P.A. encompasses all variables affecting it during any given period, relying on lagging indicators like stochastics, MACD, RSI, and others is simply inefficient. Price movements provide all the signals needed to create a profitable and high-probability trading system. These signals, known as price action trading strategies, help interpret market price movements and predict future trends with sufficient accuracy to develop a high-probability trading approach.
"Clean" Chart vs. "Jumbled" Chart- overloaded with Indicators
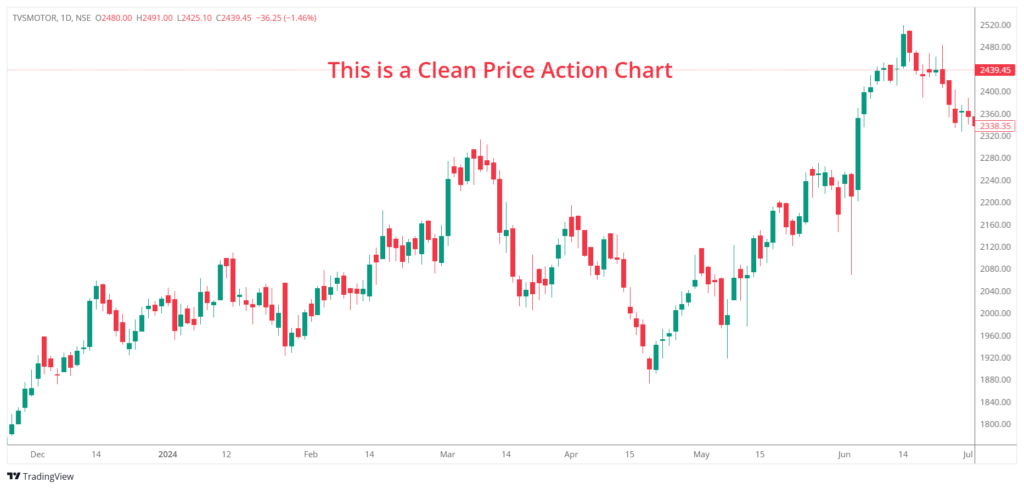
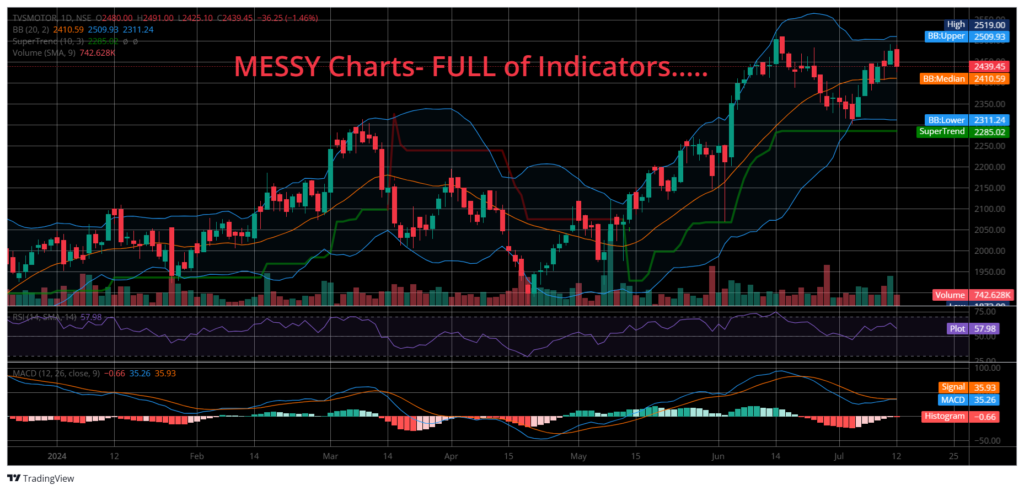
Next, Showing you a clear difference between a pure P.A. chart and one with some of the most popular trading indicators on it, I have shown two charts in the examples below. The chart on the top has no indicators on it, there’s nothing but the raw P.A. of the market on that chart. The bottom chart has MACD, RSI, Super Trend, Volume and Bollinger Bands on it; five of the most widely used indicators.
The image example below shows a clean price action chart, with no mess, and no indicators, just pure price bars:
The image example below shows a jumbled price action chart, with lots of clutter, indicators and mess:
It’s important to note that using an indicator-laden chart requires sacrificing some chart space to accommodate the indicators at the bottom. This reduction in space for the P.A. (price action) part of the chart diverts your attention away from the natural price action and onto the indicators. Consequently, not only do you have a smaller area to view the P.A., but your focus is also not entirely on the market’s price action as it should be.
When you compare both types of charts and consider which is easier to analyze and trade from, the answer becomes evident. All the indicators on the lower chart, and nearly all indicators in general, are derived from the underlying price action. Essentially, by adding indicators to their charts, traders are creating more variables for themselves without gaining any new insights or predictive information that isn’t already provided by the raw price action of the market.
Showing Few Examples of my favorite price action trading strategies
Identifying Market Trend using price action
One of the key elements of mastering P.A. trading is learning to distinguish between a trending market and a consolidating market. Trading in the direction of the trend offers the highest probability of success and is essential for making substantial profits as a trader.
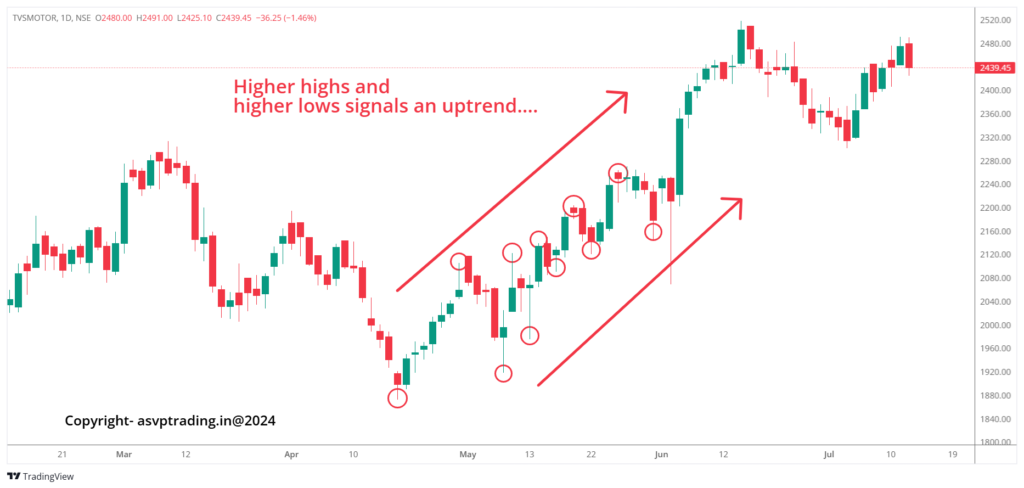
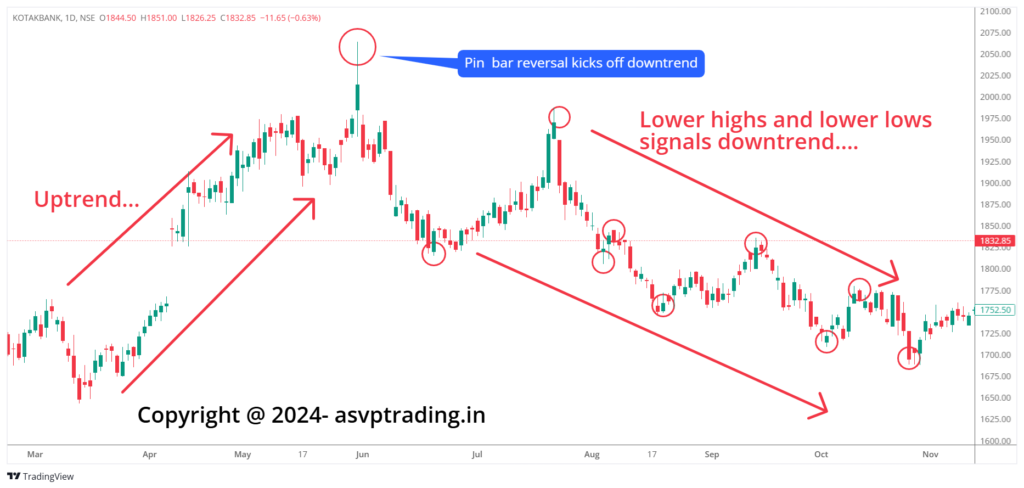
The charts below illustrate how to use price dynamics to identify market trends. A market is considered to be in an uptrend when it makes Higher Highs and Higher Lows (HH, HL), and in a downtrend when it makes Lower Highs and Lower Lows (LH, LL).
In the image example below, we can see how higher highs and higher lows shows an up-trend in a market:
In the image example below, we can see how lower highs and lower lows indicating a down-trend in a market:
Determine Trending VS. Range bound markets using price action
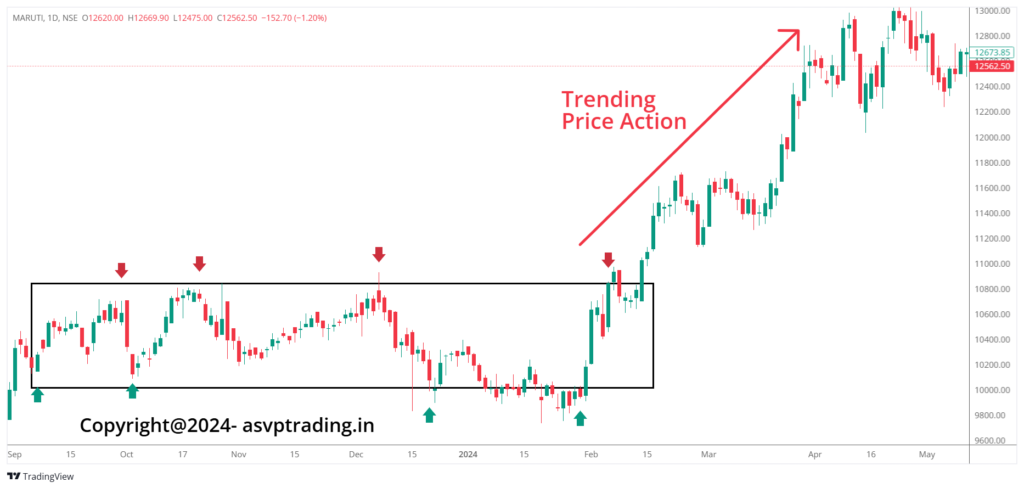
As mentioned earlier, P.A. or “price action trading analysis” involves analyzing a market’s price movements over time. Through this analysis, we can identify a market’s underlying directional bias or “trend.” If the market lacks a trend, it is considered to be “consolidating.” By examining its price action, we can easily determine if a market is trending or consolidating. We previously discussed how to identify a market’s trend; to determine if a market is consolidating, we simply look for the absence of Higher Highs (HH) and Higher Lows (HL) or Lower Highs (LH) and Lower Lows (LL) patterns. In the chart below, notice how the “consolidating price action” oscillates between horizontal support and resistance levels, moving sideways without forming HH, HL, LH, or LL patterns.
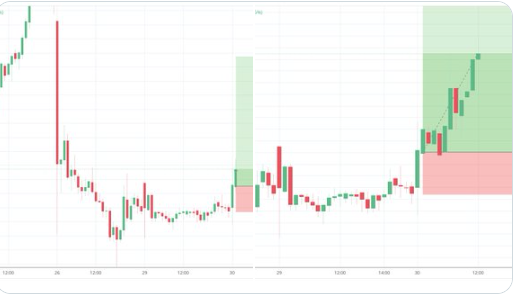
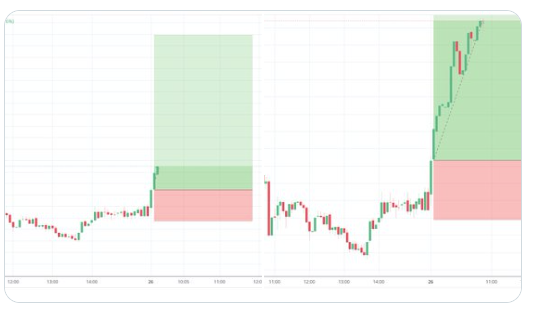
The image example below shows a market moving from a Range bound market to a trending phase:
How to Trade with Price Action Trading Techniques
So how do we trade using price action? It essentially involves learning to identify and trade P.A. setups or patterns from key levels in the market. If that sounds unfamiliar or confusing, don’t worry, I’ll explain it shortly. But first, we need to cover a few more points:
Because market participants tend to react similarly to global economic variables, a market’s P.A. often repeats itself in various patterns. These patterns, known as price action trading strategies, can be traded in many different ways. These recurring price patterns or setups reflect changes or continuations in market sentiment. In simpler terms, by learning to recognize these price action patterns, you can gain “clues” about where the market’s price is likely to move next.
The first step to start P.A. trading is to remove all unnecessary elements from your charts. Eliminate indicators, expert advisors, and everything else except the raw price bars. I prefer using candlestick charts because they convey market price data more dynamically and effectively.
I prefer simple black and white charts, as shown below. Once you’ve removed all the indicators and other unnecessary elements from your charts, you can start identifying key chart levels and looking for price action setups to trade from.
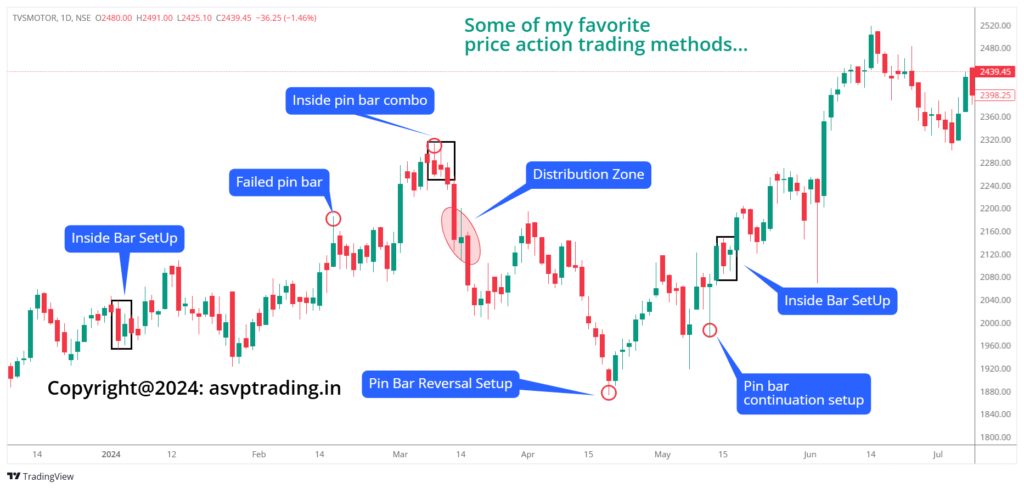
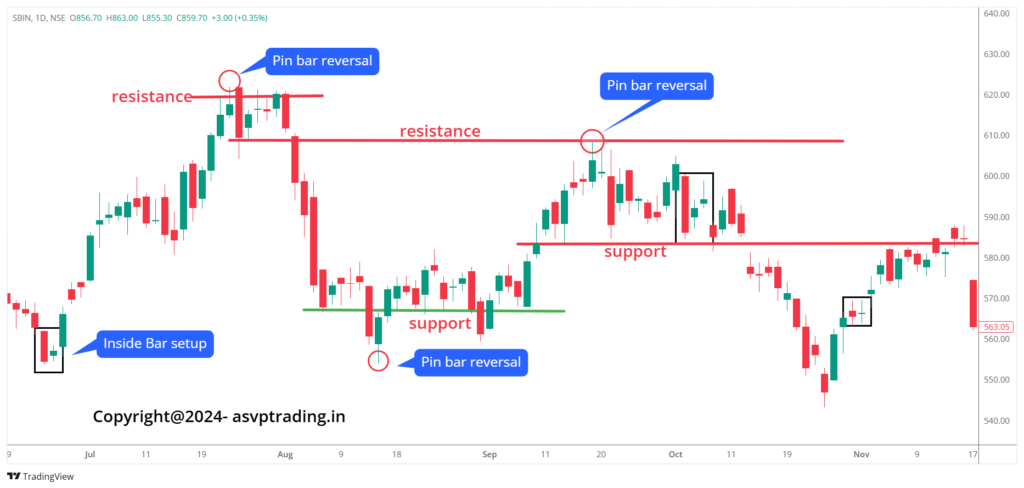
The image example below illustrates some of the trading strategies I teach in my price action trading course. Notice how the key support and resistance levels have been drawn in:
How to trade price action from confluent zones in the market:
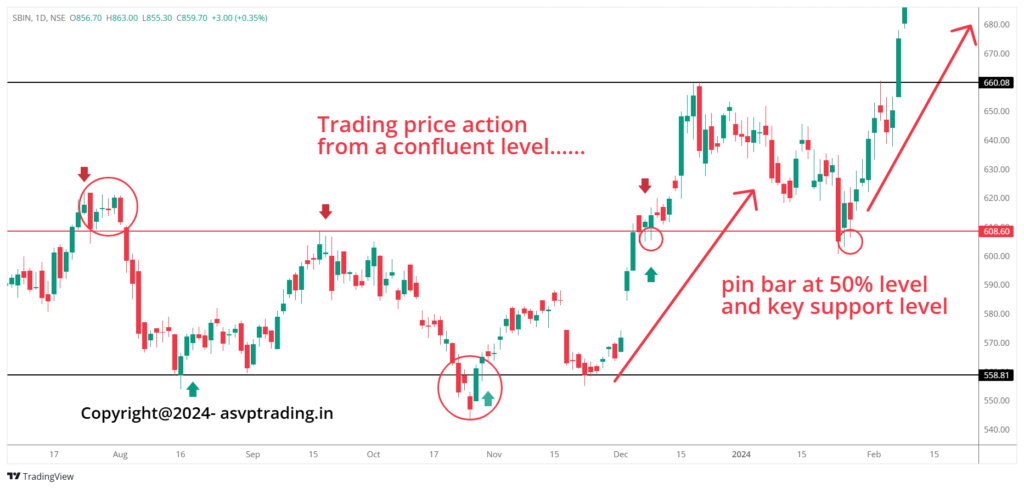
The next crucial step in trading P.A. is to draw the key chart levels and look for confluent points to trade from. In the chart below, we can observe a clear and significant pin bar setup in the script, which initiated a substantial uptrend. Notice that the pin bar setup indicated a rejection of a key horizontal support level and also aligned with the 50% retracement of the last major move. This alignment provided “confluence” with the surrounding market structure.
In the image example below, we can see a pin bar setup that formed at a confluent point in the market:
All economic factors influence price movements, which are clearly reflected on a market’s price chart. Whether these factors are interpreted by a human trader or an automated system, their impact on the market is readily observable in the price chart. Instead of attempting to analyze numerous economic variables daily (an impossible task despite attempts by many traders), one can focus on learning price action trading. This approach enables traders to effectively analyze and utilize all market variables by interpreting the patterns they create on price charts.
FINAL Remarks on Price Action Trading-
I trust that today’s overview of Price Action Trading has been beneficial and illuminating for you. Regardless of the strategy or system you ultimately adopt, a thorough grasp of P.A. will undoubtedly enhance your trading skills. If, like me, you appreciate simplicity and minimalism, you might prefer to embrace a “pure” P.A. approach by eliminating extraneous factors from your charts. For those keen on exploring my straightforward price action techniques, please check out my Price Action Trading Course for further details. You can send an email at asvptrading@gmail.com
ASVP Proprietary Price Action Course
This Level creates a base of your knowledge about trends, market structure
This Level develop insights & paves an approach how Entries & Exit can be made along with the smart money/institutions.
LIVE DATA FEED-
Economic Calendar
Data Releases of Leading Economy has severe impact on stock prices..
Start Your Journey of Financial Freedom Today!

Happy Faces of Happy Students
SUCCESS IN TRADING IS JUST A MILESTONE IN YOUR FINANCIAL JOURNEY- IT’S NOT A DESTINATION